
Another year is in the books. Now with last year in the rearview, don’t miss the opportunity to pull takeaways from your online store that can help guide your decisions for this year.
In this article, we’d are going to cover a handful of important metrics that will give you very valuable insight for making decisions to grow this revenue channel for your business.
We recommend leaning on your eCommerce platform’s analytics tools or Google Analytics to find this information for your store.
Top Products (By Revenue / By Quantity Sold)
Knowing which products are selling most off your site will give you a lot of insight for inventory control, what to feature in you various marketing efforts and even opportunities for upsells.
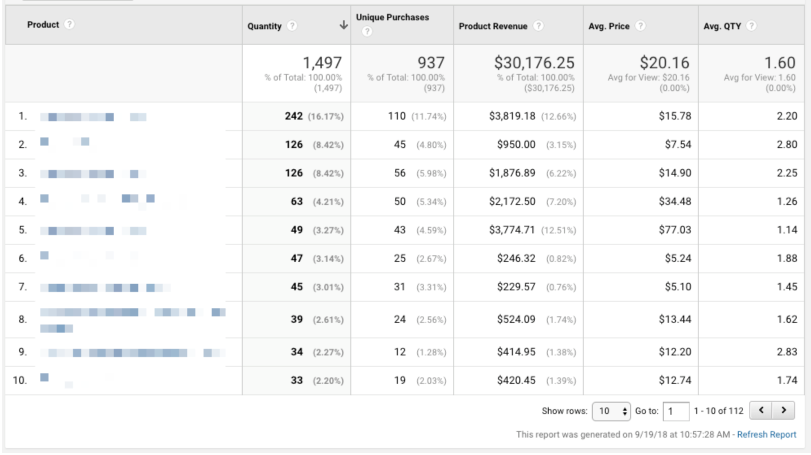
The Top Products report can be found in Google Analytics under Conversions > Ecommerce > Product Performance.
Let’s say that your top selling product is a set of sunglasses. Knowing this would show you what to feature in special collections on your homepage, as well as strategies like offering an upsell or BOGO discount on complementary products.
Abandoned Cart Rate
An abandoned cart is referring to when a visitor to your site adds items to their shopping cart, but does not complete the checkout. Often this is because they got distracted, were hesitant because of something they were uncertain about or did not want to pay the added shipping cost.
Knowing your Abandoned Cart Rate will tell you whether your efforts of addressing those barriers are working or not.
How to run a report for Abandoned Cart Rate is a little more difficult if it’s not already offered in the analytics of your chosen eCommerce platform. If using Google Analytics, you will need to set up a Goal that tracks adds to cart and checkout completions. Explaining how to do this is outside the scope of this article, but here is a good start.
Conversion Rate
CR(%) = Total Orders Placed / Total Sessions
This is the ultimate barometer of the health of your eCommerce business. Essentially, it’s telling you that for every 100 people that come to your site, “X” people end up making a purchase.
A healthy Conversion Rate is typically in the 1-5% range, depending on the industry and type of products you sell.
If the Conversion Rate on your site is low or trending downward over a period of time, then that tells you that something needs to be addressed (either with the design and experience of your site, with your marketing or with the products themselves).
Average Order Value
AOV = Total Revenue / Total Orders Placed
This is another simple calculation that offers very valuable insight into how your online business is performing. When considering strategies like upsells/cross sells and shipping discounts at a minimum order value, Average Order Value can clue you in on how those strategies are impacting your revenue.
Simply put, the higher your AOV, the better your profit margin, and the more scalable your business.
Total Traffic (30 day average)
Once you know your Conversion Rate and Average Order Value (AOV), you can now use Total Sessions (e.g. total unique visits to your site) and AOV to work backward on how to reach your revenue goals.
Let’s say you have a Conversion Rate (CR) hovering around 2% and an Average Order Value (AOV) of $65. If your revenue goal is $10,000 per month, then using the formula (sessions = (revGoal / AOV) / CR), you can determine how much traffic you need coming to your site to meet your goal each month – which, in this example, comes out to 7692 sessions.
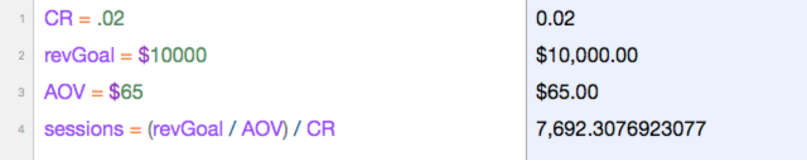
This simple formula gives you a tangible target to aim for when setting milestones for growth. Knowing where those milestones are can help keep your marketing efforts focused, which of course is never as simple as you hope.
Website Traffic (By Device)
Knowing how and where people are experiencing your store is an important launching point for what you can do to improve conversions for your store.
For example, if you’re around the industry standard of 50-75% of your traffic coming from mobile, then you know that key contributors to the user experience (mobile menus and filters, image size optimization, responsive design, etc.) have to be scrutinized at a high level. Perfecting those elements will be one of the most impactful ways to boost conversions, and that all starts with knowing what experience a majority of your visitors are getting.
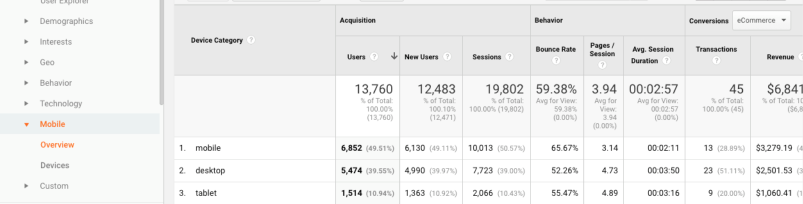
To access this report, go to Audience > Mobile > Overview. For most accurate results, view data over the last 90 days and divide by 3 to get an average.
Top Landing Pages
Landing pages are the pages on your site that people first come to when visiting your site. The reason you want to know what those top pages are is so that you know how to prioritize optimization for conversions.

In Google Analytics, go to Behavior > Site Content > Landing Pages.
This report will also tell you the Bounce Rate for those landing pages – which shows you the percentage of the people coming to your site that leave without taking any action.
If the bounce rate is high (> 30-40%), then you know that you either have a problem with the page they are landing on (poor mobile experience, confusing navigation, broken links, etc.) or you are attracting the wrong type of traffic and need to reassess your traffic building efforts.
Would you like a custom report for your online store?
These are just some of the insights that can help you have a banner year online. If you need help, we offer a specialized service that includes data analysis and a evaluation of your website’s design. The big picture goal is to provide you expert recommendations on what to prioritize to grow your store over the next year.
Find more about the service, Revive eCommerce, here.